Related Topics
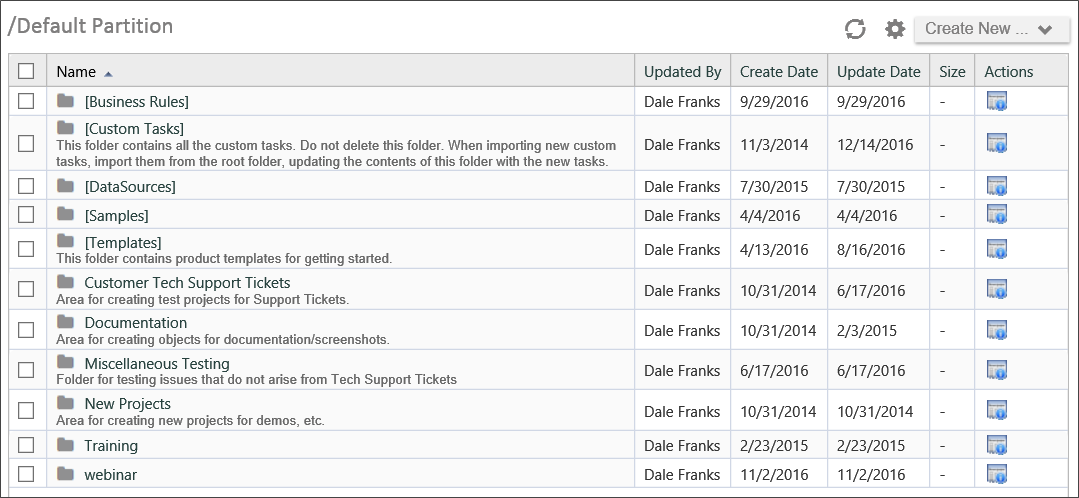
In Debug Mode, however, the Content List shows additional information:
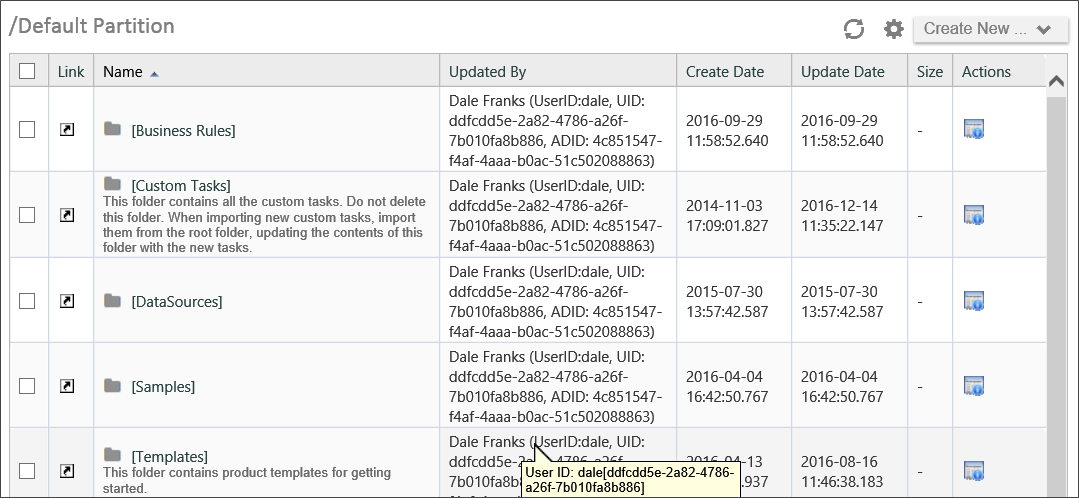
This enhanced view appears throughout the interface, including Forms, showing additional information about every object that is often useful in finding errors or other problems. For example, the image below is a portion of a running Form viewed in Debug Mode.

Note that even the disabled field at the top that contains a user's name shows debug information like the UserID and UID for the user. Additionally, placing your mouse over the Vendor name field in this example displays debug information in the field's tooltip, such as the actual field name and FCID. (The UID and FCID are GUIDs generated by the Process Director database to uniquely identify the objects.)
Debug mode can also provide extra options that aren't available in normal mode. For instance, an option exists in Debug Mode to restart all Process Timelines in an error state. This is done by entering Debug Mode in a Knowledge View that returns Process Timeline instances, and clicking on the checkbox to select all processes. A new action item will appear that says "Restart Error Workflows". Additionally, when viewing properties for Form or case instances in Debug Mode, you can edit the data directly in the instance properties, although no validation or error-checking will be performed on data edited in this way, so use caution when doing so.
Using Debug Mode, therefore, should be one of your first steps in troubleshooting an issue.
Turning on Debug Mode is simple. Depending on which version of Process Director you're using, you can use one of two methods:
- Process Director v 6.1 and higher: In the User Profile menu, click the option labeled "Debug Mode" to turn Debug mode on or off. The menu option has a text indicator to notify you if Debug Mode is on or off.
- All older versions: Place the mouse pointer in the workspace tab area at the top of the page, and click the right mouse button. This will place the page in Debug mode, and a dialog box will appear notifying you that the mode has been changed. Click the OK button to close the dialog box. To turn Debug Mode off, place the mouse pointer in the workspace tab and right-click again. A dialog box will once again appear, notifying you that Debug Mode has been turned off.
In all versions prior to Process Director v6.1, Debug Mode is available only to System or Partition Administrators. For v6.1 and higher, you can grant access to debug mode for a user by selecting the Developer property in the Edit User page of the User Administration section of the IT Admin area. Some debug functions will still be reserved for Administrators, however.
Documentation Feedback and Questions
If you notice some way that this document can be improved, we're happy to hear your suggestions. Similarly, if you can't find an answer you're looking for, ask it via feedback. Simply click on the button below to provide us with your feedback or ask a question. Please remember, though, that not every issue can be addressed through documentation. So, if you have a specific technical issue with Process Director, please open a support ticket.


